
How it was made · · 20 min read
Getting LuaJIT to actually compile your LÖVE game
LuaJIT is why a LÖVE game can do so much in Lua, and it's easy to switch off by accident, one function at a time, with nothing to tell you. Here's how its compiler really works, the three ways Vaporware EX was stopping it, the numbers for each, and a small module to check your own game.
Vaporware EX is written in Lua, on LÖVE, and on a PC that Lua runs through LuaJIT. LuaJIT is the reason a LÖVE game can do an enormous amount of work per frame in a scripting language. It is also easy to switch off by accident, one function at a time, without anything telling you. This post is how LuaJIT decides what to compile, the three ways my game was stopping it, and how to check your own.
All the numbers here are from LÖVE 12 with LuaJIT 2.1 on a desktop PC. The loops run five million times unless I say otherwise, and each time is the best of five runs.
How LuaJIT runs your code#
LuaJIT is two things in one. The first is an interpreter, which carries out your Lua's bytecode one instruction at a time, checking the type of every value as it goes. The second is a compiler that turns the parts that run the most into machine code, where an addition is one CPU instruction and not a small procedure.
The compiler doesn't compile your whole program, and it doesn't compile function by function either. It compiles traces, and almost everything in this post comes from understanding what a trace is.
Hot loops and traces#
Everything starts in the interpreter. While it runs, LuaJIT counts how often each loop goes round and how often each function is called. When a loop has gone round 56 times, LuaJIT decides it's hot and worth compiling.
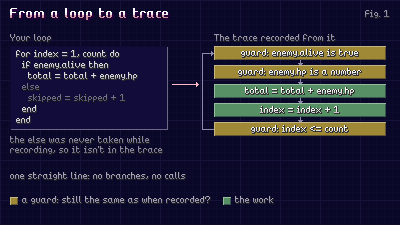
It doesn't then read the loop's source. It records it: on the next pass, the interpreter runs the loop as usual while LuaJIT writes down every operation that actually happens, in order. If the loop calls a Lua function, the recording follows it in, so the function's body ends up inline. When the recording gets back to the top of the loop, it stops. That recording is a trace: one straight line of operations, with no branches and no function calls. LuaJIT optimizes it, which is far easier without branches, and from then on the loop runs as machine code.
Guards and side traces#
A straight line can't hold an if. Where your code had one, the trace holds only the side that was taken while recording, with a guard in front of it: a quick check that the condition still comes out the same way. Guards cover more than ifs. If a variable held a number during recording, a guard checks it's still a number; if a table held a certain function under a key, a guard checks that too. The trace is the fast path for "things are the way they were when I was recorded".
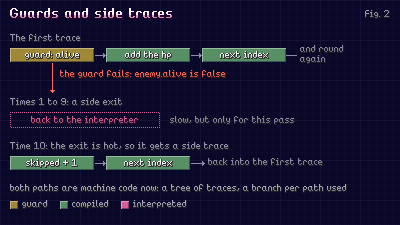
When a guard fails, the trace takes a side exit back to the interpreter, which carries on from there. Once the same exit has been taken 10 times, LuaJIT records a side trace starting from it, attached to the first. So a function with several common paths ends up as a little tree of traces, one branch per path that's actually used.
When the compiler gives up#
The compiler can't handle every operation Lua has. If the recording runs into one it can't, it aborts: the recording is thrown away and the loop carries on in the interpreter. LuaJIT tries again later, in case a different path avoids the problem, and after enough failures in the same place it stops trying for good.
An abort isn't an error. Nothing is printed and your game behaves the same. It's just slower, often ten or twenty times slower in that piece of code, and the only way to know is to look.
Calls it can't see into#
A recording can follow a call into a Lua function, but not into a function written in C, which includes nearly everything under love.. LuaJIT handles that by ending the trace at the call, running the C function from the interpreter, and starting a new trace after it. That's called stitching. Nothing fails, but the loop is now two traces with a trip through the interpreter between them.
The trace cache#
Finished traces are kept in a cache with two limits: how many traces, and how much machine code. When either is reached, LuaJIT doesn't drop the oldest trace. It flushes: every trace is thrown away, and the hot loops are found and recorded again from nothing.
So there are three ways to lose the compiler: the cache fills up and is flushed, a recording aborts, or a trace is stitched at a C call. My game was doing all three.
Watching the compiler work#
Before fixing anything, you need to be able to see it. jit.attach, built into LuaJIT, calls a function of yours whenever a trace is started, finished, aborted or flushed, so it works in LÖVE with nothing to install. This small module counts all three problems, and remembers the line each abort and each stitch happened on:
-- jitwatch.lua: counts what LuaJIT's compiler is doing, and where it gives up or has to stop
local JitWatch = {
    available = false, compiled = 0, aborted = 0, stitched = 0, flushes = 0, abortSites = {}, stitchSites = {},
}

-- adds one to the count for the line of code at func and pc
local function countSite(sites, util, func, pc)
    local info = util.funcinfo(func, pc)
    local site = (info.source or "?"):gsub("^@", "") .. ":" .. (info.currentline or 0)
    sites[site] = (sites[site] or 0) + 1
end

function JitWatch:Start()
    local hasUtil, util = pcall(require, "jit.util")
    if not (jit and jit.status() and hasUtil) then
        return -- no LuaJIT here (the web build), or its compiler is off
    end
    self.available = true
    jit.attach(function(event, _, func, pc, _, parentExit)
        if event == "stop" then
            self.compiled = self.compiled + 1 -- a trace was finished and is now machine code
        elseif event == "flush" then
            self.flushes = self.flushes + 1 -- the cache filled up and every trace was thrown away
        elseif event == "abort" then
            self.aborted = self.aborted + 1 -- the compiler gave up on a trace: note the line it was on
            countSite(self.abortSites, util, func, pc)
        elseif event == "start" and parentExit == -1 then
            -- a trace starting just after a C call, because the one before had to stop there: note the call's line
            self.stitched = self.stitched + 1
            countSite(self.stitchSites, util, func, pc)
        end
    end, "trace")
end

function JitWatch:Reset()
    self.compiled, self.aborted, self.stitched, self.flushes = 0, 0, 0, 0
    self.abortSites, self.stitchSites = {}, {}
end

-- kept out here, not written inside WorstSites: a function made fresh on every call can't be compiled
local function highestCountFirst(first, second)
    return first.count > second.count
end

-- the most often counted lines in abortSites or stitchSites, worst first
function JitWatch:WorstSites(sites, limit)
    local worst = {}
    for site, count in pairs(sites) do
        worst[#worst + 1] = { site = site, count = count }
    end
    table.sort(worst, highestCountFirst)
    for index = #worst, limit + 1, -1 do
        worst[index] = nil
    end
    return worst
end

return JitWatch
Call JitWatch:Start() in love.load, play your game for a few minutes, and print the counts. Here's how to read them:
flushesabove zero means the trace cache is too small for your game. That's the next section.compiledstill climbing after several minutes means LuaJIT keeps finding new paths to compile. Some of that is normal; a lot of it fills the cache.- A line near the top of
WorstSites(JitWatch.abortSites, 10)with a count in the dozens is code the compiler keeps trying and failing to compile. Ones and twos are nothing to worry about. A short loop inside a function that's called from another loop shows a few, and so does LÖVE's own Lua. - The lines in
stitchSitesare C calls that cut a trace in two. The counts are how often the compiler met that call while compiling, not how often it runs, so a high one means a call in the middle of a lot of different hot code.
The trace cache is too small for a real game#
LuaJIT's own limit is 1,000 traces. LÖVE doubles it to 2,000 and allows 16 MB of machine code, which is plenty for a small game. I checked where the limit bites by making 3,000 different small loops and running each until it was hot: the flush came at loop number 1,999.
Vaporware EX passes 2,000 traces within a few seconds of play. From then on the cache was flushed about every 14 seconds, all session long, and 4% of every frame went to the compiler rebuilding what it had just thrown away. A flush doesn't show up as one long frame, but as a few seconds of slower, uneven frames while everything is recorded again, which is much harder to pin down.
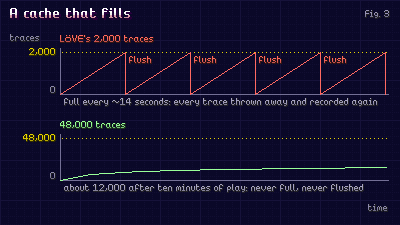
Ten minutes of play needed about 12,000 traces, around 11 MB of machine code. So the fix is to ask for a bigger cache, at the very top of main.lua, before anything else gets hot:
if jit and jit.status() then
    jit.opt.start("maxtrace=48000", "maxmcode=98304", "hotexit=40")
endmaxtraceis how many traces there can be. The most it can be is 65,535.maxmcodeis the limit on machine code, in kilobytes, so this is 96 MB. That's a ceiling and not a reservation: memory is only taken as traces are made.hotexitis how many times a side exit has to be taken before it gets a side trace. LuaJIT's default is 10.
I started with 16,000, which was enough until I fixed the problems in the rest of this post. With more of the game compiling there were more traces, 16,000 filled in under ten minutes, and a flush at that size meant about 40 seconds of choppier frames. Leave yourself room.
hotexit came from watching the count over a long session: even after half an hour, the game was adding about 500 traces a minute. Once a game has warmed up, nearly every new trace is a side trace, and the longer you play, the more rarely used branches reach 10: a tooltip you've opened ten times, a menu you've visited ten times. Each becomes a trace that will hardly ever run. At 40 there were 39% fewer traces after 15 minutes, and no screen got slower.
The if jit check matters if you ship a web build. LÖVE on the web runs plain Lua with no LuaJIT at all, so jit doesn't exist there.
One closure stops a whole function compiling#
This is the one that surprised me most. Here are two functions that do the same thing when rare is false, which in this test it always is:
local function withClosure(value, rare)
    if rare then
        local doubled = function() return value + value end
        return doubled()
    end
    return value + 1
end

local function plain(value, rare)
    if rare then
        return value + value
    end
    return value + 1
end
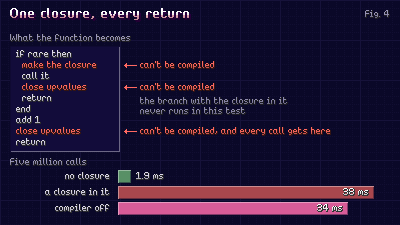
Five million calls to plain take 1.9 ms. Five million calls to withClosure take 38 ms, twenty times as long, and the branch with the closure in it never ran once. For comparison, plain with the compiler switched off takes 34 ms. The first function gets nothing from LuaJIT's compiler at all.
The reason is in how closures work. The inner function uses value, a local of the outer function. That local lives on the stack and is gone when the outer function returns, so if a closure has captured it, Lua has to move it somewhere safe first, which is called closing the upvalue. Lua can't know in advance whether the closure was made on this call, so a function with a closure anywhere in it gets a "close upvalues" instruction before every return, including the ones on paths that never go near the closure.
LuaJIT's compiler can't compile that instruction, so every recording through the function aborts at its return. In the test above, JitWatch counts 22 aborts on the return value + 1 line and no finished trace. And since recordings follow calls, the loop that called the function is lost with it.
Making a closure can't be compiled either, which is the more obvious half of this. An iterator that returns a new function every time it's used aborts every recording that reaches it:
-- makes a new function on every call: can't be compiled
local function each(list)
    local index = 0
    return function()
        index = index + 1
        return list[index]
    end
end

-- the same loop with nothing made: the state is passed in and handed back, as ipairs does it
local function nextItem(list, index)
    index = index + 1
    local item = list[index]
    if item then
        return index, item
    end
end

local function eachStateless(list)
    return nextItem, list, 0
end
Walking a 50-item list 100,000 times took 11.4 ms with the first and 4.2 ms with the second.
In a game, this hides in the functions that run every frame: update and draw methods with a closure tucked into a branch for something occasional. I had a dozen, including every button's draw function, the function that colors text, and the iterator over the stack of focused windows. Clearing them cut the aborts in a session by 56%. A second round, moving 34 more functions that were being made on every call out to the top of their files, took what was left down by another 45%. There are three ways to do it, in the order I'd reach for them:
- Don't make a function at all. If you're wrapping a method to pass it somewhere, pass the method and the object separately.
- Make it once and keep it. Build the function when the object is made, or at the top of the file, and pass it what it needs as arguments.
- Move the rare branch into a function of its own. The closure is still made, and that path still isn't compiled, but the function that runs every frame no longer has a closure in it, so its returns are clean.
Here's the third, since it's the least obvious:
-- before: Draw has a closure in it, so no trace through Draw is ever finished
function Button:Draw()
    if self.hovered and self.tooltip then
        self:Clipped(function() self:DrawTooltip() end)
    end
    self:DrawFace()
end

-- after: Draw compiles, and only the hovered button pays
function Button:DrawHovered()
    self:Clipped(function() self:DrawTooltip() end)
end

function Button:Draw()
    if self.hovered and self.tooltip then
        self:DrawHovered()
    end
    self:DrawFace()
end
A C function isn't the fast option#
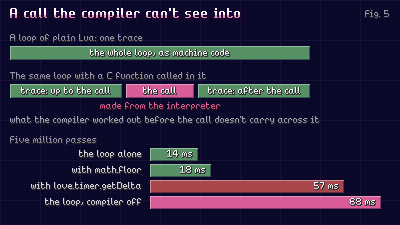
LÖVE is written in C++, and it's natural to think of its functions as the fast part and your Lua as the slow part. Under the interpreter that's true. Under the compiler it's the other way round, because of stitching: every call to C ends the trace, and nothing the compiler worked out before the call carries across it.
There's one big exception. LuaJIT knows its own standard library, so math.floor, math.sin, math.max and most of their neighbors aren't calls at all once compiled: they become a few machine instructions inside the trace. LÖVE also makes a few of its busiest functions visible to the compiler (more on how below). love.math.random is one, and it costs the same as math.random.
Here's a loop doing a little arithmetic, with one extra call added to it:
- The loop alone: 14 ms
- With a call to
math.floor: 18 ms - With a call to
love.timer.getDelta: 57 ms - The loop with the compiler switched off entirely: 68 ms
getDelta does almost nothing: it hands back a number LÖVE already has. One call to it per pass still cost most of what the compiler was saving.
I learned this from a mistake of my own. Vaporware EX runs on a fork of LÖVE, and early on I added round, clamp, lerp and some easing curves to the engine in C++, on the theory that C++ would be faster for small math. The game draws on a pixel grid, so nearly every draw loop calls round. When I profiled an hour of play, more time was going to interpreted Lua (14.7%) than to compiled Lua (13%): those little helpers were cutting every draw loop into pieces. I rewrote them in plain Lua:
local floor, ceil = math.floor, math.ceil

-- rounds halves away from zero, as C's round does. floor(x + 0.5) gets 0.49999999999999994 wrong
local function round(x)
    if x >= 0 then
        local whole = floor(x)
        if x - whole >= 0.5 then
            return whole + 1
        end
        return whole
    end
    local whole = ceil(x)
    if whole - x >= 0.5 then
        return whole - 1
    end
    return whole
end

local function clamp(value, low, high)
    if value < low then
        return low
    elseif value > high then
        return high
    end
    return value
end
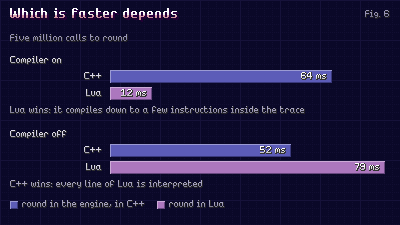
Five million calls to the C++ round took 64 ms. The Lua one takes 12 ms. With the compiler off it flips: 52 ms for C++ and 79 ms for Lua. Both beliefs are right, each for its own half of LuaJIT.
One warning if you do the same: my C++ lerp worked in single precision and Lua numbers are doubles, so the two disagree around the seventh decimal place. That's invisible on screen, but game rules that round a lerped value could land on a different whole number, so game logic kept an exact match of the old one.
Then LÖVE's own calls#
With the helpers gone, I ran the game for 15 minutes with JitWatch counting stitches. Of 40,180 traces started, 6,508 started only because the one before had stopped at a C call. My helpers were off the list, and LÖVE's own calls topped it. Lua's string patterns were on it too: to the compiler, find, match, gmatch and gsub with a pattern are C calls like any other.
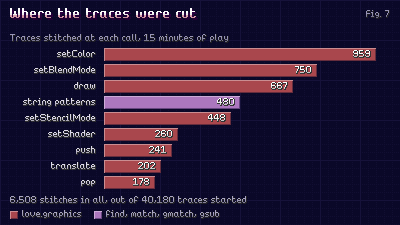
I'd assumed a draw call does so much work that leaving the trace for it couldn't matter. But most draw code isn't draw calls. It's Lua working out where things go and what color they are, with a setColor or a push every few lines, so it was running as a string of short traces with a trip through the interpreter between each one.
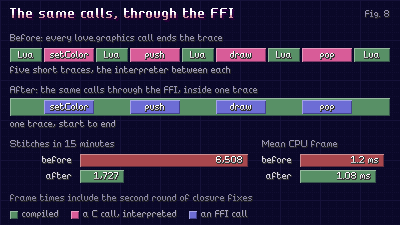
The fix is the one LÖVE uses for love.math.random: LuaJIT's FFI, its foreign function interface. A regular LÖVE function is written against Lua's C API, taking its arguments off Lua's stack and pushing its results back, and the compiler can't see what that does. Through the FFI, you declare a C function's exact signature (four floats in, nothing out) and call it directly. Because the compiler knows exactly what goes in and what comes out, it can put the call inside the trace, and the trace carries on past it.
Vaporware EX runs on its own fork of LÖVE, so I gave about two dozen of the busiest calls plain C versions, and a little Lua inside the engine puts FFI wrappers in place of the regular functions when the compiler is on. Here's the shape of one, simplified:
-- inside the engine: fast is a struct of plain C function pointers the C++ side handed over
local regularSetColor = love.graphics.setColor

function love.graphics.setColor(r, g, b, a)
    if type(r) == "number" and type(g) == "number" and type(b) == "number" and (a == nil or type(a) == "number") then
        fast.setColor(r, g, b, a or 1) -- an FFI call: compiled into the trace
    else
        regularSetColor(r, g, b, a) -- a table of colors, or a mistake: the regular function, and its error message
    end
end
Only the common form of each call takes the fast path, so every error message is as it was, and without the compiler the regular functions stay. The game's own code never touches the FFI: it stays inside the engine, so a platform without it can do without it.
Stitches fell from 6,508 to 1,727 in the same 15 minutes. Along with the second round of closure fixes, the average CPU time of a frame went from about 1.2 ms to 1.08 ms, around 11% less, and every busy screen I measured got faster. A single run on my PC can drift by 0.4 ms, so that's from six pairs of runs, old and new taken in turns.
What this means for a stock LÖVE game:
- Every
love.graphicscall cuts the trace, so cut the cheap ones. Don't give up a draw you need, but don't set a color that's already set, draw the things that share a blend mode or shader together, and use aSpriteBatchwhere many sprites are drawn alike. - Keep string patterns out of code that runs every frame. Work out what you need from a string once and keep the answer.
- Keep C calls out of loops that are otherwise pure Lua.
love.graphics.getWidth(),love.timer.getTime(),love.mouse.getPosition(): ask once a frame, keep the answer in a local, and use that inside the loop. - Write small helpers in Lua. A vector add, a clamp, a distance: the compiler turns these into a few instructions, and it can't do that with anything in C.
- On the web it's the reverse. There's no compiler there, so every line is interpreted and a C function is the faster choice. I decided the PC build mattered more.
- If you build LÖVE yourself, the FFI is the way to make a hot C++ function cheap to call from compiled Lua. Keep the regular function as the fallback, and keep the FFI out of your game's own code.
Smaller rules, measured#
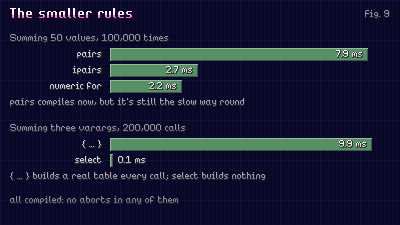
pairs is fine now, but arrays are still faster. The usual advice is that LuaJIT can't compile pairs, and for a long time that was true. On the LuaJIT in LÖVE 12 it compiles with no aborts, but it's still the slow way round a table. Summing 50 values 100,000 times took 7.9 ms with pairs, 2.7 ms with ipairs and 2.2 ms with a numeric for. On an older LÖVE, run JitWatch on a pairs loop and see whether it aborts. Either way, keep anything you walk every frame in an array.
Don't pack varargs into a table in a function that runs a lot. The compiler is good at tables that never leave the trace: a { x, y, z } used and dropped in the same loop is never really made at all (this is called allocation sinking). local args = { ... } is one it can't do that for, so a real table is built on every call and the garbage collector has to clean it up later. 200,000 calls summing three arguments took 9.9 ms packed, and 0.1 ms walking the same arguments with select("#", ...) and select(index, ...).
Give each class one metatable. Guards check that a table's metatable is the same one the trace was recorded with. If your constructor builds a new metatable for every object, every object fails that guard, and a method that should be one trace becomes a side trace per object. Make the metatable once, next to the class, and give it to every instance.
Try it yourself#
Here's a main.lua to go with jitwatch.lua. It runs the closure test from above every frame, 500,000 calls of it, and shows the time and what the compiler did. Space switches between the two versions.
-- main.lua: the same sum with and without a closure in the function it calls. Space switches
local JitWatch = require("jitwatch")

local Demo = { useClosure = true, calls = 500000, sampleTime = 0, sampleFrames = 0, shownMilliseconds = 0 }

-- never asked for the rare branch here, but the closure inside it is enough to stop this compiling
function Demo.ScoreWithClosure(value, rare)
    if rare then
        local doubled = function() return value + value end
        return doubled()
    end
    return value + 1
end

function Demo.ScorePlain(value, rare)
    if rare then
        return value + value
    end
    return value + 1
end

function Demo:SumWithClosure()
    local total = 0
    for index = 1, self.calls do
        total = total + self.ScoreWithClosure(index, false)
    end
    return total
end

function Demo:SumPlain()
    local total = 0
    for index = 1, self.calls do
        total = total + self.ScorePlain(index, false)
    end
    return total
end

function Demo:Draw()
    local started = love.timer.getTime()
    if self.useClosure then
        self:SumWithClosure()
    else
        self:SumPlain()
    end
    self.sampleTime = self.sampleTime + love.timer.getTime() - started
    self.sampleFrames = self.sampleFrames + 1
    if self.sampleFrames == 30 then
        self.shownMilliseconds = self.sampleTime / self.sampleFrames * 1000
        self.sampleTime, self.sampleFrames = 0, 0
    end

    local mode = self.useClosure and "with a closure" or "plain"
    love.graphics.print(string.format("%s: %.2f ms for %d calls (space to switch)", mode,
        self.shownMilliseconds, self.calls), 8, 10)
    if not JitWatch.available then
        love.graphics.print("LuaJIT's compiler isn't running here, so there's nothing to count", 8, 40)
        return
    end
    love.graphics.print(string.format("traces compiled: %d   aborted: %d   cut at a C call: %d   cache flushes: %d",
        JitWatch.compiled, JitWatch.aborted, JitWatch.stitched, JitWatch.flushes), 8, 40)
    for index, entry in ipairs(JitWatch:WorstSites(JitWatch.abortSites, 8)) do
        love.graphics.print(string.format("gave up %d times at %s", entry.count, entry.site), 8, 60 + index * 18)
    end
end

function love.load() JitWatch:Start() end
function love.draw() Demo:Draw() end
function love.keypressed(key)
    if key == "space" then
        Demo.useClosure = not Demo.useClosure
        Demo.sampleTime, Demo.sampleFrames = 0, 0
    end
end
On my machine it shows about 4.4 ms with the closure and well under 1 ms without, and "gave up 22 times at main.lua:12", which is the return value + 1 line. Then put jitwatch.lua in your own game and see what it says.
What to take from it#
- LuaJIT compiles the paths your code actually takes, one straight line at a time. Anything that ends a line early, or stops one being finished, sends that code back to the interpreter without telling you.
- Raise the trace cache at the top of
main.lua. LÖVE's 2,000 traces is a small-game setting. - Keep closures out of anything that runs every frame, including the branches that hardly ever run.
- Small math belongs in Lua. A C function is only the fast option when the compiler is off.
- Every C call cuts a trace, LÖVE's included. Count where it happens, and trim the cheap calls in code that runs every frame.
- Measure before and after. Most of what I believed about what was fast came from the interpreter's rules, and the compiler has different ones.
Not every cost was LuaJIT's. Where it was in what I was asking LÖVE to do, like laying out the same text again every frame, the fix was a cache: that's the story in Making text almost free to draw in LÖVE.
The whole sample#
All 2 files from this post, put together: about 130 lines of plain Lua for LÖVE 11.5.
Run it as it is with love jit-watch.zip, or unzip it and run love . in the folder.